

Bad News on Inflation
Chief Economist Scott Brown discusses current economic conditions.
October inflation figures were higher than expected. More troublesome, the range of items with higher inflation, relatively narrow in the spring, appears to be widening. Inflation expectations for the next five years have risen. Higher inflation is dampening consumer sentiment. The University of Michigan measures hit a decade low early November (but that doesn’t appear to be hurting household spending). Supply chain difficulties should clear up over time, but it may be a while. Longer-term inflation expectations remain moderate, reflecting the view that the Fed will act if inflation doesn’t fall back on its own.
The CPI rose 0.9% in October, boosted by a 6.1% increase in gasoline prices. Ex-food & energy, the CPI rose 0.6%, reflecting a 2.5% rise in used vehicle prices. The CPI rose 6.2% year-over-year, the highest since the first Gulf War (a year ago, the year-over-year pace was 1.1%). Restart pressures have been a key factor behind this year’s pickup in inflation. As in every recovery, it takes time for the economy to rebound. Pressures were expected to be amplified by the fact that there was a lot to come back from, and speed of the recovery was especially brisk in the first half of the year following federal fiscal stimulus and the rapid arrival of vaccines. In addition, the shift from consumer services to goods now appears to be a long-lasting phenomenon. October retail sales results will show levels far above the pre-pandemic trend. Supply chain issues are expected to continue into 2022.
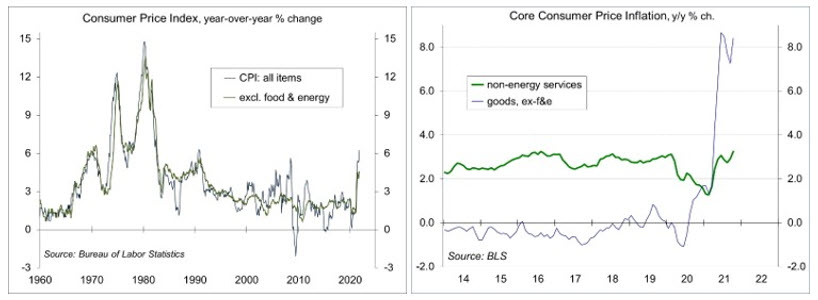
The shift from services to goods explains much of this year’s increase in inflation. Inflation in consumer goods had been close to 0% (even a bit negative) over the years leading up to the pandemic. It’s sharply higher now. For services, Owner’s Equivalent Rent (OER) is a key category (it accounts for 23.6% of the overall CPI and 30.0% of the core CPI). The Bureau of Labor Statistics seeks to measure the cost of the service that a home provides, not the asset value, so considers the rental equivalent for homeowners. One sixth of the housing sample is updated each month, so it takes some time before higher rents are fully factored into the CPI. OER rose 0.44% in October, a 3.1% increase from a year ago, but a 4.6% annual rate in the last three months.
Higher wages are not driving much of the current inflation, but faster wage growth can reinforce higher price inflation. In September, 4.4 million workers quit their jobs, presumably to take a better offer elsewhere. Higher wages should lure some potential workers back into the labor force and help keep current workers from exiting. Hiring and worker retention are expected to be a major issue for firms in 2022, especially as white- collar workers can more easily work outside the traditional office. Yet. wage increases have failed to match price increases – if that continues, consumer spending growth will slow.
For Fed policymakers, the recent inflation news has to be a concern. However, raising short-term interest rates would do nothing to fix supply chains. Higher rates would slow demand, but also risk a more significant downturn. There’s a lot of seasonal noise in the economy through the start of the year. We should have a clearer picture in the spring.
The Consumer Price Index rose 0.9% in October (+6.2% y/y), boosted by a 6.1% rise in gasoline prices (+49.6% y/y). Ex-food and energy, the CPI rose 0.6% (+4.6% y/y), partly reflecting a 2.5% increase in used vehicles (+26.4% y/y). The Bureau of Labor Statistic noted that price increases were broad-based.
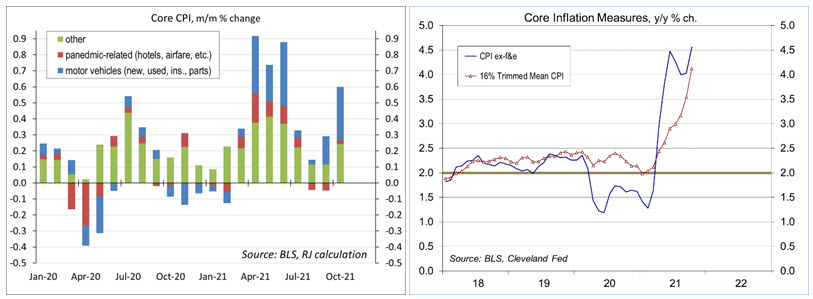
The Cleveland Fed’s Trimmed-Mean CPI, which excludes the 8% highest and 8% lowest changes in CPI components, rose 0.7% in October (+4.1% y/y), suggesting that price increases are widening (vs. a narrow range of higher inflation in the spring).
The Producer Price Index rose 0.6% in October (+8.6% y/y, vs. +0.6% y/y a year ago), up 0.4% (+6.2% y/y, vs.
+0.9% y/y a year ago) ex-food, energy, and trade services. Pipeline pressures increase. The index for unprocessed intermediate goods rose 8.4% (+56.6% y/y), while the index for processed intermediate goods rose 2.1% (+25.4% y/y). The index for construction rose 6.6% in October (+12.3% y/y).
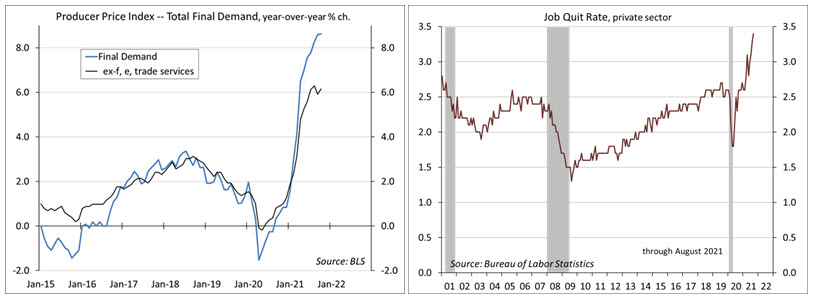
Job openings fell back to 10.4 million in September (9.6 million for the private sector), following a record 11.1 million (10.0 million private-sector) in July. The quit rate rose to another record high – 4.4 million quit their jobs in September, 3.0% of those working (and 3.4% for the private sector).
Gauging the Recovery
The New York Fed’s Weekly Economic Index fell to 6.62% for the week ending November 6, vs. +7.41% a week earlier (revised from 7.23%). The WEI is scaled to y/y GDP growth (+4.9% y/y in 3Q21).
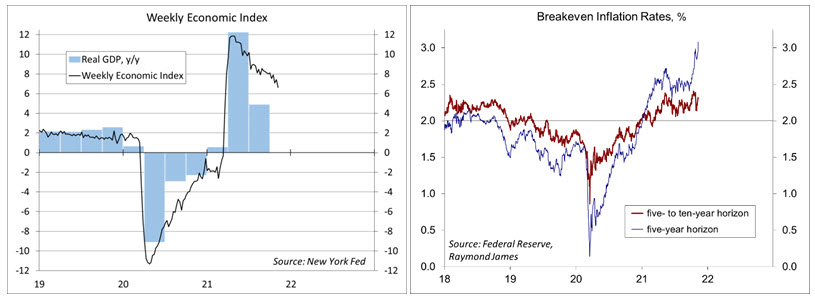
Breakeven inflation rates (the spread between inflation-adjusted and fixed-rate Treasuries) continue to suggest a more elevated near-term inflation outlook. The 5- to 10-year outlook remains at a moderate level.
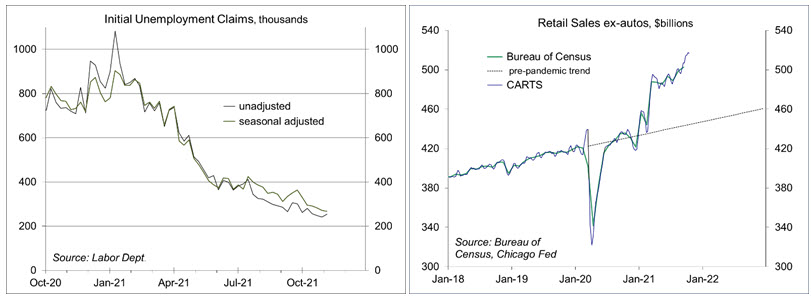
Chicago Fed Advance Retail Trade Summary (CARTS): down 0.1% in the final week of October, following a 0.4% gain in the previous week and sharper gains at the start of the month. October retail sales (ex-autos) were projected to rise 2.6% from September, up 1.8% adjusted for inflation.
Jobless claims fell by 4,000, to 267,000 (another pandemic low) in the week ending November 6. Claims are approaching pre-pandemic level, consistent with a tighter labor market.
The University of Michigan’s Consumer Sentiment Index fell to 66.8 in the mid-month assessment for September (vs. 71.7 in September and 72.8 in August), the lowest in a decade, reflecting higher inflation. Nominal income gains were widely reported, but half of all households anticipated lower real incomes next year.
The opinions offered by Dr. Brown are provided as of the date above and subject to change. For more information about this report – to discuss how this outlook may affect your personal situation and/or to learn how this insight may be incorporated into your investment strategy – please contact your financial advisor or use the convenient Office Locator to find our office(s) nearest you today.
This material is being provided for informational purposes only. Any information should not be deemed a recommendation to buy, hold or sell any security. Certain information has been obtained from third-party sources we consider reliable, but we do not guarantee that such information is accurate or complete. This report is not a complete description of the securities, markets, or developments referred to in this material and does not include all available data necessary for making an investment decision. Prior to making an investment decision, please consult with your financial advisor about your individual situation. Investing involves risk and you may incur a profit or loss regardless of strategy selected. There is no guarantee that the statements, opinions or forecasts provided herein will prove to be correct.
Investment products are: not deposits, not FDIC/NCUA insured, not insured by any government agency, not bank guaranteed, subject to risk and may lose value. Raymond James financial advisors do not render legal or tax advice. Please consult a qualified professional regarding legal or tax advice.
All expressions of opinion reflect the judgment of Raymond James & Associates, Inc. and are subject to change. There is no assurance any of the trends mentioned will continue or that any of the forecasts mentioned will occur. Economic and market conditions are subject to change. Investing involves risk including the possible loss of capital. The S&P 500 is an unmanaged index of 500 widely held stocks. It is not possible to invest directly in an index. The market performance noted does not include fees and charges which would affect an investor’s returns. Past performance may not be indicative of future results.
 Reagan Kennedy
  Bethany Griscom
 Andrea Schroeder
  Kimberly Fehre
 Marjorie Onuwa
  Maddie Yerkes
 Maggie Slivinski
 Gene Donato
 James (Jim) Messner III
 Alexa Comey
 Henry (Hank) J. Schroeder, CFP®
 Keith R. Hering AAMS®, CRPS®, CIMA®
  Jack W. Kennedy III, CFP®, AAMS®